
Men’s and Women’s NCAA Division 1 teams face a number of unprecedented challenges in 2021, one of which is the ever growing transfer portal. As of today, there are more or less 1,000 players available in each of the portals and every team / player is left with a number of decisions. Evaluating the “best” player is an important task and obviously can yield positive results, but the fit, AKA the how and why, is just as important.
Fit, both from the player’s perspective as well as the team’s, is a crucial aspect of the modern NCAA. A high volume three point sniper who plays excellent on ball defense may be a great fit on most rosters, but this is not a foregone conclusion. Analyzing the type of offense, the level of shot creation, the pace of a team, the level of competition, the expected usage/role of a player, all are important elements to consider. Because fit and maximization is important for the player as well as for the team. As the volume and frequency of transfers continues to increase, the need to find a role that fits the player as well as the team is growing more important.
This analysis needs to start internally – “What did we lose, What do we need” and then move to the available transfers – “Does this player fill a gap for us?, Is this a role that the player is willing to step into?” Additionally, the analysis needs to be as close to apples to apples as possible. Comparing per game stats may provide an idea on that player but misses pace / offensive & defensive efficiency / role / and much more.
Adjusting the data to focus on rates, shooting percentages, four factors, and probably most importantly pace adjusted per possession numbers will ensure that players can be more accurately compared to each other. If Player X plays for a fast paced + high three point volume + high turnover forcing team, then these factors should be taken into account. Playing 30 minutes a game at a 70 possession per game pace will yield SIGNIFICANTLY different results than playing 30 minutes a game at a 60 possession per game pace. These two players may have the same role and operate with the same efficiency but the first player will be viewed as “better” on a per game or per minute basis. Eliminating these opportunities for misleading analysis will ensure that players can be properly compared and contrasted.
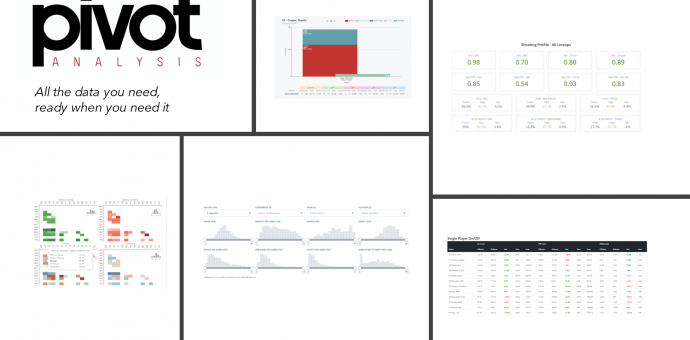
Additionally, the use of on-court single player lineup data can provide an additional layer of analysis that illuminates certain elements of a player’s game. Rim protection is a great example. Blocks are obviously part of the equation but how do you account for opposing teams deciding not to drive because of the presence of a particularly good rim protector? This kind of impact is only detectable by tracking the proportion and effectiveness of shots at the rim when a certain player is on the floor. The same is true for a player who boxes out well but doesn’t get the rebound. Changes in on-court rebound rates are a great indicator of a good “rebounder” regardless of whether or not they are the one who collects the board. All of these are subset of the broader on-court offensive/defensive and net ratings, which show at the highest level how a team performs with a certain player on the floor. The generation of accurate per possession data and the integration of any on-court metric necessitates the use of play-by-play and lineup data and this is where Pivot Analysis can help provide value.
In addition to our standard in-season team support, Pivot Analysis recently developed and is currently maintaining a dashboard for each of the transfer portals. During the season we tracked every event and possession by every team in Division 1 (M & W) and this data has given us a great mechanism to evaluate each DI team as well as all the players who are currently in a transfer portal. In order to learn more about what Pivot can do for you, please visit us on the web at or email us at [email protected].